好好学习,天天向上

我的年度读书报告生成攻略:第二部分

上一个部分解释了如何根据目标获取数据源,接下来,可以对已读图书清单进行分析了。

获取指定年度的数据

因为我们是对某个年度进行分析,所以需要将特定年度的数据筛选出来。这里,先将数据读进 pandas.DataFrame 中:

1
2
3
4
5
6
7
8
import json
from pandas import DataFrame, Series

path = 'item.json'
# read
records = [json.loads(line.strip().strip(",")) for line in open(path)]
df = DataFrame(records)
print(df.head(1))

已读日期保存在 readDate 中,而这个数据的类型是 object,值格式诸如 2018-12-06\n 读过。因此我们需要将其转换成 datetime,以便于提取:

1
2
3
4
5
6
7
8
9
10
11
12
13
14
# 提取有效已读日期
def valid_read_date(d):
if len(d) > 0:
tmp = d.split("\n")
if len(tmp) > 0:
return tmp[0].strip()
return "Missing"

df['readDate'] = df['readDate'].apply(valid_read_date)
#print(df['readDate'].head())
df['readDate'] = pd.to_datetime(df['readDate'])

# 设置已读日期为索引
df = df.set_index('readDate')

处理后,如果我们想获取的是 2018 的数据,就可以像下面这样直接获得:

1
df_2018 = df['2018']
## 哪些书籍评分最高,哪些书籍令人大失所望

拿到了指定年份的数据后,我们就可以着手分析了。

每本书的评分信息存储在 rating 字段中。其中,rating5-t 表示五星,rating4-t 表示四星,以此类推。为了方便,我们可以定义一个映射表,又来规整下数据:

1
2
3
4
5
6
mapping = {
"rating5-t": "5.0",
"rating4-t": "4.0",
"rating3-t": "3.0",
"rating2-t": "2.0",
}
然后就可以绘制饼图来看下每个评分占的比例了。
1
2
3
4
5
6
7
8
9
10
11
12
13
14
15
def rating_count(df, path=""):
# 给缺失或未知对评分填上替代值
clean_rating = df['rating'].fillna('Missing')
clean_rating[clean_rating == 'date'] = 'Missing'
clean_rating[clean_rating == ''] = 'Unknown'
for k, v in mapping.items():
clean_rating[clean_rating == k] = v
rating_counts = clean_rating.value_counts()
# 绘图
rc = rating_counts.plot(kind='pie', autopct='%.2f', figsize=(8,8))
if path:
fig = rc.get_figure()
fig.savefig(path)

rating_count(df_2018)
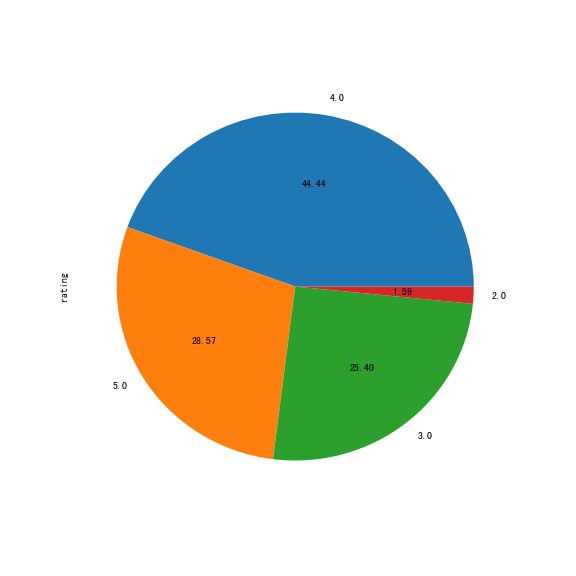
执行后得到:

从绘制出来的图可以看出,2018 年评为四星的书最多,五星的书次之,而最低评级为两星。可以查看具体哪些书强推,那些书令人大失所望:

1
2
3
print("rating 5:\n", df_2018[df_2018["rating"] == 'rating5-t'][['name', 'catagory']])
print()
print("rating 2:\n", df_2018[df_2018["rating"] == 'rating2-t'][['name', 'catagory']])

一年中都看了什么类型的书?

为了检查下已阅书籍有没有达到计划中的“博览”,需要检查下类别情况。

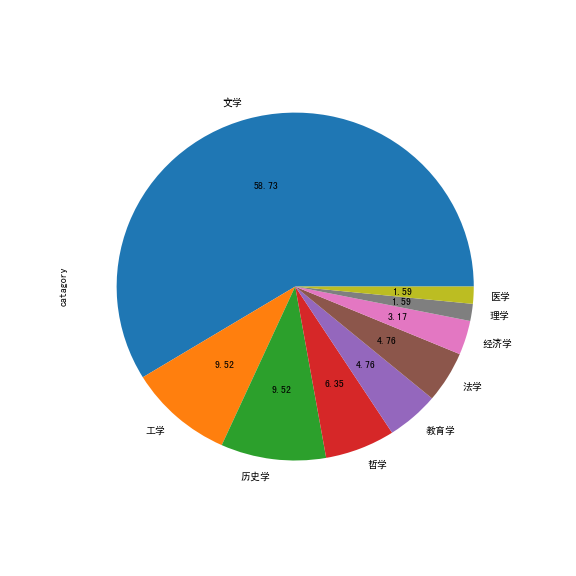
从上一篇文章中,我们知道,类别数据可以从 catagory 字段取得。因为该字段的格式有如 文学(1),因此我们需要对其进行清理,去掉括号,以便统计:

1
2
3
4
5
6
def clear_catagory(c):
if "(" in c:
return c[:c.index("(")]
return c

df_2018["catagory"] = df_2018["catagory"].apply(clear_catagory)

然后就可以像评级信息那样绘制饼图了:

1
2
3
4
5
6
7
8
9
10
11
12
13
14
15
16
17
18
19
20
import matplotlib.pyplot as plot

import matplotlib.pyplot as plt # 引入matplotlib包
plt.rcParams['font.sans-serif']=['SimHei']# 设置加载的字体名
plt.rcParams['axes.unicode_minus']=False

# 对类别进行计数
def catagory_count(df, path=""):
# 给缺失或未知对类别填上替代值
clean_catagory = df['catagory'].fillna('Missing')
clean_catagory[clean_catagory == ''] = 'Unknown'
clean_catagory[clean_catagory == 'not found'] = u'文学'
catagory_counts = clean_catagory.value_counts()
# 绘图
cc = catagory_counts.plot(kind='pie', autopct='%.2f', figsize=(8,8))
if path:
fig = cc.get_figure()
fig.savefig(path)

catagory_count(df_2018)

执行后得到:

根据上面的图可以得出,2018 涉猎的领域确实有所增加。

查看标签情况

类别信息有时过于泛泛,例如上面文学类占了一半有余,但是却无法直观的看出所阅书籍的具体情况。此时标签信息就派上用场了。

照例,因为 tags 字段是像 标签: 绘本 生活 治愈 这样的字符串信息,所以我们需要将无效的“标签: ”部分移除。另外,为了便于统计,我们还需要将其转换为列表:

1
2
3
4
5
6
7
8
9
10
11
12
def clear_tag(v):
res = []
if not v:
return res

items = v.split(" ")
for k in items:
if k.startswith("标签"):
continue
res.append(k.strip())
return res
df_2018["tags"] = df_2018["tags"].apply(clear_tag)

这样,我们就可以对标签信息进行统计并生成词云了。这里,词云使用 wordcloud 库来生成:

1
2
3
4
5
6
7
8
9
10
11
12
13
14
15
16
17
18
19
20
21
from pandas import Series
def list_count(s):
lc = s.apply(lambda x: Series(x).value_counts()).sum()
stat = lc.iteritems()
return {x[0]: x[1] for x in stat}

# 生成词云
from wordcloud import WordCloud
def word_cloud_gen(d, save_to="wordcloud.png"):
# Generate a word cloud image
wordcloud = WordCloud(font_path="/System/Library/Fonts/STHeiti Medium.ttc", width=800, height=400).fit_words(d)

# Display the generated image:
# the matplotlib way:
import matplotlib.pyplot as plt
plt.imshow(wordcloud, interpolation='bilinear')
plt.axis("off")
# 保存
#wordcloud.to_file(save_to)

word_cloud_gen(list_count(df_2018["tags"]), "wordcloud_2018.png")

执行后得到:

好了,2018 看的书有点奇怪 (>﹏<)

总结一下

初尝数据分析,有献丑之嫌。但是通过这一遭,对数据分析这件事倒是增添了几分兴趣。毕竟,分析不了国家大事,可以对小我进行分析呀!

希望 2019 年可以读更多好书,年终可以分析出更多东西,就酱~

请言小午吃个甜筒~~